AHRI Releases December 2020 U.S. Heating and Cooling Equipment Shipment Data
2021-02-12
February 12, 2021
Residential Storage Water Heaters
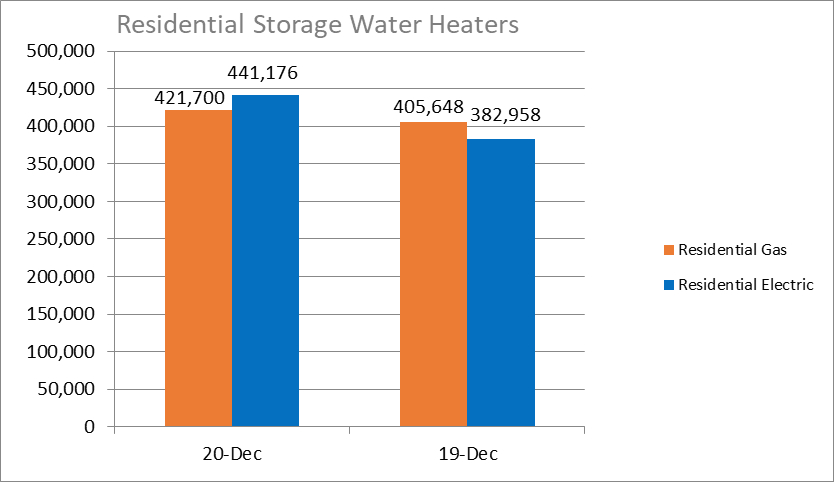
U.S. shipments of residential gas storage water heaters for December 2020 increased 4 percent, to 421,700 units, up from 405,648 units shipped in December 2019. Residential electric storage water heater shipments increased 15.2 percent in December 2020 to 441,176 units, up from 382,958 units shipped in December 2019.

Year-to-date U.S. shipments of residential gas storage water heaters increased 4.7 percent, to 4,584,367 compared to 4,377,001 shipped during that same period in 2019. Residential electric storage water heater shipments increased 10.8 percent year-to-date, to 4,653,688 units, compared to 4,201,274 shipped during the same period in 2019.
U.S. shipments of residential gas storage water heaters for December 2020 increased 4 percent, to 421,700 units, up from 405,648 units shipped in December 2019. Residential electric storage water heater shipments increased 15.2 percent in December 2020 to 441,176 units, up from 382,958 units shipped in December 2019.

Year-to-date U.S. shipments of residential gas storage water heaters increased 4.7 percent, to 4,584,367 compared to 4,377,001 shipped during that same period in 2019. Residential electric storage water heater shipments increased 10.8 percent year-to-date, to 4,653,688 units, compared to 4,201,274 shipped during the same period in 2019.
| Year-to-Date | |||
| Dec 20 YTD | Dec 19 YTD | %CHG. | |
| Residential Storage Gas | 4,584,367 | 4,377,001 | +4.7 |
| Residential Storage Electric | 4,653,688 | 4,201,274 | +10.8 |
Commercial Storage Water Heaters
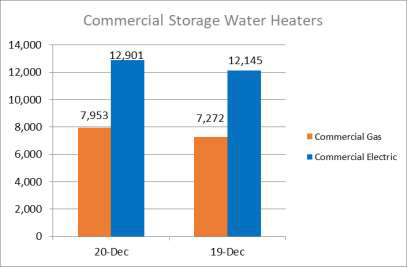
Commercial gas storage water heater shipments increased 9.4 percent in December 2020, to 7,953 units, up from 7,272 units shipped in December 2019. Commercial electric storage water heater shipments increased6.2 percent in December 2020, to 12,901 units, up from 12,145 units shipped in December 2019.

Year-to-date U.S. shipments of commercial gas storage water heaters decreased 9.6 percent, to 80,070 units, compared with 88,548 units shipped during the same period in 2019. Year-to-date commercial electric storage water heater shipments decreased 6.6 percent, to 140,666 units, down from 150,667 units shipped during the same period in 2019.
| Year-to-Date | |||
| Dec 20 YTD | Dec 19 YTD | %CHG. | |
| Commercial Storage Gas | 80,070 | 88,548 | -9.6 |
| Commercial Storage Electric | 140,666 | 150,667 | -6.6 |
Warm Air Furnaces
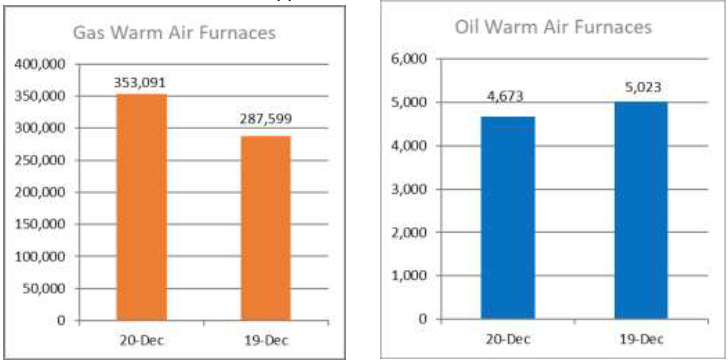
U.S. shipments of gas warm air furnaces for December 2020 increased 22.8 percent, to 353,091 units, up from 287,599 units shipped in December 2019. Oil warm air furnace shipments decreased 7 percent, to 4,673 units in December 2020, down from 5,023 units shipped in December 2019.
Year-to-date U.S. shipments of gas warm air furnaces decreased 2.6 percent, to 3,351,176 units, compared with 3,441,872 units shipped during the same period in 2019. Year-to-date U.S. shipments of oil warm air furnaces decreased 10.3 percent, to 36,505 units, compared with 40,692 units shipped during the same period in 2019.

Year-to-date combined shipments of central air conditioners and air-source heat pumps increased 10.1 percent, to 9,328,762 units, up from 8,469,615 units shipped during the same period in 2019. Year-to-date shipments of central air conditioners increased 10.3 percent, to 5,910,284 units, up from 5,359,775 units shipped during the same period in 2019. The year-to-date total for heat pump shipments increased 9.9 percent, to 3,418,478, up from 3,109,840 units shipped during the same period in 2019.
| Year-to-Date | |||
| Dec 20 YTD | Dec 19 YTD | %CHG. | |
| Gas Warm Air Furnaces | 3,351,176 | 3,441,872 | -2.6 |
| Oil Warm Air Furnaces | 36,505 | 40,692 | -10.3 |
Central Air Conditioners and Air-Source Heat Pumps
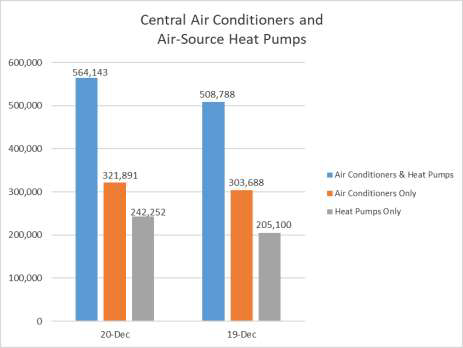
U.S. shipments of central air conditioners and air-source heat pumps totaled 564,143 units in December 2020, up 10.9 percent from 508,788 units shipped in December 2019. U.S. shipments of air conditioners increased 6 percent, to 321,891 units, up from 303,688 units shipped in December 2019. U.S. shipments of air-source heat pumps increased 18.1 percent, to 242,252 units, up from 205,100 units shipped in December 2019.
Year-to-date combined shipments of central air conditioners and air-source heat pumps increased 10.1 percent, to 9,328,762 units, up from 8,469,615 units shipped during the same period in 2019. Year-to-date shipments of central air conditioners increased 10.3 percent, to 5,910,284 units, up from 5,359,775 units shipped during the same period in 2019. The year-to-date total for heat pump shipments increased 9.9 percent, to 3,418,478, up from 3,109,840 units shipped during the same period in 2019.
| Year-to-Date | |||
| Dec 20 YTD | Dec 19 YTD | %CHG. | |
| Air Conditioners & Heat Pumps Combined Total | 9,328,762 | 8,469,615 | +10.1 |
| Air Conditioners Only | 5,910,284 | 5,359,775 | +10.3 |
| Heat Pumps Only | 3,418,478 | 3,109,840 | +9.9 |
U.S. Manufacturers’ Shipments of Central Air Conditioners and Air-Source Heat Pumps
| Month | ||
| Size Description (000) BTUH |
Total |
% Change from 2019 |
| Under 16.5 | 24,970 | +48.1 |
| 16.5-21.9 | 64,245 | +29.4 |
| 22-26.9 | 108,574 | +9.7 |
| 27-32.9 | 82,351 | +2.6 |
| 33-38.9 | 108,752 | +2.1 |
| 39-43.9 | 43,880 | +16.2 |
| 44-53.9 | 60,321 | +11.7 |
| 54-64.9 | 51,005 | +18.9 |
| 65-96.9 | 7,197 | -7.0 |
| 97-134.9 | 5,152 | -12.1 |
| 135-184.9 | 3,699 | -15.3 |
| 185-249.9 | 1,491 | -1.5 |
| 250-319.9 | 1,323 | +19.5 |
| 320-379.9 | 265 | -25.8 |
| 380-539.9 | 336 | +13.5 |
| 540-639.9 | 223 | -0.9 |
| 640-799.9 | 122 | -10.9 |
| 800.0-899.9 | 38 | -47.2 |
| 900.0-999.9 | 56 | -42.9 |
| 1,000.0-1,199.9 | 46 | +4.5 |
| 1,200.0 & Over | 97 | |
| TOTAL | 564,143 | +10.9 |
| YTD | ||
| Size Description (000) BTUH |
Total |
% Change from 2019 |
| Under 16.5 | 357,759 | +17.8 |
| 16.5-21.9 | 864,142 | +16.8 |
| 22-26.9 | 1,830,740 | +12.0 |
| 27-32.9 | 1,483,746 | +11.3 |
| 33-38.9 | 1,984,554 | +10.7 |
| 39-43.9 | 717,084 | +10.1 |
| 44-53.9 | 1,040,749 | +9.8 |
| 54-64.9 | 787,593 | +4.0 |
| 65-96.9 | 92,770 | -15.4 |
| 97-134.9 | 69,076 | -17.5 |
| 135-184.9 | 46,644 | -18.1 |
| 185-249.9 | 20,780 | -17.2 |
| 250-319.9 | 17,257 | +7.5 |
| 320-379.9 | 3,892 | -7.8 |
| 380-539.9 | 4,141 | -5.7 |
| 540-639.9 | 3,112 | -0.2 |
| 640 & Over | 1,408 | -13.7 |
| 800.0-899.9 | 772 | -8.2 |
| 900.0-999.9 | 867 | +5.2 |
| 1,000.0-1,199.9 | 605 | +15.2 |
| 1,200.0 & Over | 1,071 | -23.2 |
| TOTAL | 9,328,762 | +10.1 |
A shipment is defined as when a unit transfers ownership; a consignment is not a transfer of ownership. Industry data is aggregated from the information supplied by AHRI member companies that participate in the statistics program and can be subject to revision. Published year-to-date data is inclusive of all revisions. No other AHRI data (e.g., by state or region) is available to the public other than that published. AHRI does not conduct any market forecasting and is not qualified to discuss market trends. BTUHs of 64.9 and below are for residential units; 65.0 and above for commercial.
For previous monthly shipment releases and historical data, please see http://www.ahrinet.org/statistics.
<1>How do my colleagues subscribe thereport?
Go to http://www.ahrinet.org/statistics and click on Subscribe.
<2>Does this data represent shipments to the United States only or are shipments outside of the United States included?
This data represents shipments to customers in the United States only.
<3>Do you provide U.S. data by state?
That data is not available publicly.
<4>Is historical data available in Excel?
It is available monthly reflecting exactly the data presented in the monthly public release.
<5>Can I purchase additional industry data from AHRI?
No, AHRI Statistics data are not for sale.
<6>How much the industry does the datarepresent?
Although we cannot get into specifics about how much of the industry the data represents, in general, AHRI is one of the largest trade associations in the nation, representing more than 300 heating, water heating, ventilation, air conditioning and commercial refrigeration manufacturers within the global HVACR industry. AHRI’s 300+ member companies account for more than 90 percent of the residential and commercial air conditioning, space heating, water heating, and commercial refrigeration equipment manufactured and sold in North America.


